Data on Materiality(Environment)Materiality (Material Issues)
Actual CO2 emissions Contribute to a decarbonized,
recycling-oriented society
In January 2021, the Group confirmed the actual results of CO2 emissions and set objectives for 2030 and 2050 in relation to “Contribution to helping achieve a decarbonized society and a recycling-oriented society,” one of the material issues of the Group.
-
FY2024
-
FY2023
-
FY2022
-
FY2021
-
FY2020
(base year)
Actual CO2 emissions (FY2024)
| Domestic Beverage Business | Pharmaceutical-Related Business | Food Business | Total | Range of each scope | |
|---|---|---|---|---|---|
| Scope1 | 7,638 | 3,687 | 3,917 | 15,243 | Domestic Beverage Business: Gasoline for commercial and route vehicles / city gas, propane, kerosene for offices and sales offices Pharmaceutical-Related Business: Gasoline for commercial vehicles and forklifts Food Business: Gasoline for commercial vehicles and forklifts |
| Scope2 | 1,752 | 4,379 | 4,691 | 10,821 | Domestic Beverage Business: Electricity for offices and sales offices Pharmaceutical-Related Business: Electricity for offices, sales offices and factories Food Business: Electricity for offices, sales offices, and factories |
| Total | 9,390 (97.8%) |
8,066 (106.1%) |
8,608 (105.5%) |
26,064 (102.7%) |
|
| Scope3 Category1 |
43,137 | 20,452 | 10,590 | 74,179 | Domestic Beverage Business : Energy used in beverage production Pharmaceutical-Related Business : Energy used in container manufacturing Food Business : Energy used in container manufacturing |
| Scope3 Category4 |
9,279 | 420 | - | 9,699 | Domestic Beverage Business: Emissions associated with transportation from the contracted factory to the warehouse Food Business: Emissions associated with transportation and delivery from the container manufacturing plant to our company |
| Scope3 Category9 |
7,142 | 73 | 15,139 | 22,354 | Domestic Beverage Business: Emissions associated with vending machine operations outsourced to other companies Pharmaceutical and Food Businesses: Emissions generated in the process from shipment of products to their delivery from retailers or distributors to end consumers |
| Scope3 Category13 |
88,065 (90.4%) |
- | - | 88,065 (90.4%) |
Domestic Beverage Business: Power consumption by vending machines |
Actual CO2 emissions: the sales intensity (FY2024)
| Domestic Beverage Business | Pharmaceutical-Related Business | Food Business | Total | Range of each scope | |
|---|---|---|---|---|---|
| Scope1 | 0.07 | 0.28 | 0.19 | 0.11 | Domestic Beverage Business: Gasoline for commercial and route vehicles / city gas, propane, kerosene for offices and sales offices Pharmaceutical-Related Business: Gasoline for commercial vehicles and forklifts Food Business: Gasoline for commercial vehicles and forklifts |
| Scope2 | 0.02 | 0.33 | 0.23 | 0.08 | Domestic Beverage Business: Electricity for offices and sales offices Pharmaceutical-Related Business: Electricity for offices, sales offices and factories Food Business: Electricity for offices, sales offices, and factories |
| Total | 0.09 (102.7%) |
0.61 (83.5%) |
0.42 (106.8%) |
0.18 (104.9%) |
|
| Scope3 Category1 |
0.39 | 1.56 | 0.51 | 0.52 | Domestic Beverage Business : Energy used in beverage production Pharmaceutical-Related Business : Energy used in container manufacturing Food Business : Energy used in container manufacturing |
| Scope3 Category4 |
0.08 | 0.03 | - | 0.07 | Domestic Beverage Business: Emissions associated with transportation from the contracted factory to the warehouse Food Business: Emissions associated with transportation and delivery from the container manufacturing plant to our company |
| Scope3 Category9 |
0.06 | 0.01 | 0.73 | 0.16 | Domestic Beverage Business: Emissions associated with vending machine operations outsourced to other companies Pharmaceutical and Food Businesses: Emissions generated during the process from product shipment to final delivery to consumers via retailers or distributors |
| Scope3 Category13 |
0.80 (94.9%) |
- | - | 0.61 (72.6%) |
Domestic Beverage Business: Power consumption by vending machines |
- Note 1: The actual emissions in the domestic beverage business are those for DyDo DRINCO, Inc., DyDo Beverage Service, Inc., and DyDo Business Service, Inc.
- Note 2: We underwent a third-party verification for greenhouse gas emission information on 99 domestic bases of DyDo DRINCO, Inc., DyDo Beverage Service, Inc., DyDo Business Service, Inc., DAIDO pharmaceutical Corporation, and Tarami Corporation. (Updated August 2025)
- Note 3: Emissions per unit of sales is obtained by dividing the total emissions of target group companies (period: April 1, 2024 - March 31, 2025) by total sales (period: domestic beverage business; Pharmaceutical-Related Business: January 21, 2024 - January 20, 2025; Food Business: January 1, 2024 - December 31, 2025)
- * DyDo Beverage Service, Inc. absorbed Asahi Beverage Sales Co., Ltd. on January 21, 2025, and changed its name to DyDo Asahi Vending, Inc.
Actual CO2 emissions (FY2023)
| Domestic Beverage Business | Pharmaceutical-Related Business | Food Business | Total | Range of each scope | |
|---|---|---|---|---|---|
| Scope1 | 7,383 | 3,872 | 3,834 | 15,089 | Domestic Beverage Business: Gasoline for commercial and route vehicles / city gas, propane, kerosene for offices and sales offices Pharmaceutical-Related Business: Gasoline for commercial vehicles and forklifts Food Business: Gasoline for commercial vehicles and forklifts |
| Scope2 | 1,577 | 4,424 | 5,377 | 11,378 | Domestic Beverage Business: Electricity for offices and sales offices Pharmaceutical-Related Business: Electricity for offices, sales offices and factories Food Business: Electricity for offices, sales offices, and factories |
| Total | 8,961 (93.3%) |
8,296 (109.1%) |
9,211 (112.9%) |
26,468 (104.3%) |
|
| Scope3 Category1 |
68,024 | 17,674 | 11,418 | 97,116 | Domestic Beverage Business : Energy used in beverage production Pharmaceutical-Related Business : Energy used in container manufacturing Food Business : Energy used in container manufacturing |
| Scope3 Category13 |
90,213 (92.6%) |
- | - | 90,213 (92.6%) |
Domestic Beverage Business: Power consumption by vending machines |
Actual CO2 emissions: the sales intensity (FY2023)
| Domestic Beverage Business | Pharmaceutical-Related Business | Food Business | Total | Range of each scope | |
|---|---|---|---|---|---|
| Scope1 | 0.07 | 0.30 | 0.19 | 0.10 | Domestic Beverage Business: Gasoline for commercial and route vehicles / city gas, propane, kerosene for offices and sales offices Pharmaceutical-Related Business: Gasoline for commercial vehicles and forklifts Food Business: Gasoline for commercial vehicles and forklifts |
| Scope2 | 0.01 | 0.34 | 0.26 | 0.08 | Domestic Beverage Business: Electricity for offices and sales offices Pharmaceutical-Related Business: Electricity for offices, sales offices and factories Food Business: Electricity for offices, sales offices, and factories |
| Total | 0.08 (95.1%) |
0.64 (86.9%) |
0.44 (113.9%) |
0.18 (104.1%) |
|
| Scope3 Category1 |
0.60 | 1.36 | 0.55 | 0.66 | Domestic Beverage Business : Energy used in beverage production Pharmaceutical-Related Business : Energy used in container manufacturing Food Business : Energy used in container manufacturing |
| Scope3 Category13 |
0.80 (94.3%) |
- | - | 0.80 (94.3%) |
Domestic Beverage Business: Power consumption by vending machines |
- Note 1: The actual emissions in the domestic beverage business are those for DyDo DRINCO, Inc., DyDo Beverage Service, Inc., and DyDo Business Service, Inc.
- Note 2: We underwent a third-party verification for greenhouse gas emission information on 99 domestic bases of DyDo DRINCO, Inc., DyDo Beverage Service, Inc., DyDo Business Service, Inc., DAIDO pharmaceutical Corporation, and Tarami Corporation. (Updated September 2024)
- Note 3: Emissions per unit of sales is obtained by dividing the total emissions of target group companies (period: April 1, 2023 - March 31, 2024) by total sales (period: domestic beverage business; Pharmaceutical-Related Business: January 21, 2023 - January 20, 2024; Food Business: January 1, 2023 - December 31, 2023)
- * DyDo Beverage Service, Inc. absorbed Asahi Beverage Sales Co., Ltd. on January 21, 2025, and changed its name to DyDo Asahi Vending, Inc.
Actual CO2 emissions (FY2022)
| Domestic Beverage Business | Pharmaceutical-Related Business | Food Business | Total | Range of each scope | |
|---|---|---|---|---|---|
| Scope1 | 7,195 | 4,333 | 3,734 | 15,262 | Domestic Beverage Business: Gasoline for commercial and route vehicles / city gas, propane, kerosene for offices and sales offices Pharmaceutical-Related Business: Gasoline for commercial vehicles and forklifts Food Business: Gasoline for commercial vehicles and forklifts |
| Scope2 | 1,511 | 3,778 | 4,273 | 9,562 | Domestic Beverage Business: Electricity for offices and sales offices Pharmaceutical-Related Business: Electricity for offices, sales offices and factories Food Business: Electricity for offices, sales offices, and factories |
| Total | 8,706 (90.6%) |
8,111 (106.7%) |
8,007 (98.1%) |
24,824 (97.9%) |
|
| Scope3 | 91,952 (94.4%) |
- | - | 91,952 (94.4%) |
Domestic Beverage Business: Power consumption by vending machines |
Actual CO2 emissions: the sales intensity (FY2022)
| Domestic Beverage Business | Pharmaceutical-Related Business | Food Business | Total | Range of each scope | |
|---|---|---|---|---|---|
| Scope1 | 0.07 | 0.35 | 0.19 | 0.11 | Domestic Beverage Business: Gasoline for commercial and route vehicles / city gas, propane, kerosene for offices and sales offices Pharmaceutical-Related Business: Gasoline for commercial vehicles and forklifts Food Business: Gasoline for commercial vehicles and forklifts |
| Scope2 | 0.01 | 0.30 | 0.22 | 0.07 | Domestic Beverage Business: Electricity for offices and sales offices Pharmaceutical-Related Business: Electricity for offices, sales offices and factories Food Business: Electricity for offices, sales offices, and factories |
| Total | 0.08 (95.4%) |
0.65 (88.0%) |
0.41 (104.8%) |
0.17 (101.2%) |
|
| Scope3 | 0.84 (99.3%) |
- | - | 0.84 (99.3%) |
Domestic Beverage Business: Power consumption by vending machines |
- Note 1: The actual emissions in the domestic beverage business are those for DyDo DRINCO, Inc., DyDo Beverage Service, Inc., and DyDo Business Service, Inc.
- Note 2: We underwent a third-party verification for greenhouse gas emission information on 87 domestic bases of DyDo DRINCO, Inc., DyDo Beverage Service, Inc., and DyDo Business Service, Inc.
- Note 3: Emissions per unit of sales is obtained by dividing the total emissions of target group companies (period: April 1, 2022 - March 31, 2023) by total sales (period: domestic beverage business; Pharmaceutical-Related Business: January 21, 2022 - January 20, 2023; Food Business: January 1, 2022 - December 31, 2022)
- Note 4: Historical emissions and emissions per unit of sales have been changed due to tabulation errors and changes in emission factors at some locations. (Updated August 2023)
- * DyDo Beverage Service, Inc. absorbed Asahi Beverage Sales Co., Ltd. on January 21, 2025, and changed its name to DyDo Asahi Vending, Inc.
Actual CO2 emissions (FY2021)
| Domestic Beverage Business | Pharmaceutical-Related Business | Food Business | Total | Range of each scope | |
|---|---|---|---|---|---|
| Scope1 | 7,268 | 4,296 | 3,993 | 15,557 | Domestic Beverage Business: Gasoline for commercial and route vehicles / city gas, propane, kerosene for offices and sales offices Pharmaceutical-Related Business: Gasoline for commercial vehicles and forklifts Food Business: Gasoline for commercial vehicles and forklifts |
| Scope2 | 1,379 | 3,763 | 5,499 | 10,641 | Domestic Beverage Business: Electricity for offices and sales offices Pharmaceutical-Related Business: Electricity for offices, sales offices and factories Food Business: Electricity for offices, sales offices, and factories |
| Total | 8,647 (90.0%) |
8,059 (106.0%) |
9,492 (116.3%) |
26,198 (103.3%) |
|
| Scope3 | 94,890 (97.4%) |
- | - | 94,890 (97.4%) |
Domestic Beverage Business: Power consumption by vending machines |
Actual CO2 emissions: the sales intensity (FY2021)
| Domestic Beverage Business | Pharmaceutical-Related Business | Food Business | Total | Range of each scope | |
|---|---|---|---|---|---|
| Scope1 | 0.06 | 0.39 | 0.19 | 0.10 | Domestic Beverage Business: Gasoline for commercial and route vehicles / city gas, propane, kerosene for offices and sales offices Pharmaceutical-Related Business: Gasoline for commercial vehicles and forklifts Food Business: Gasoline for commercial vehicles and forklifts |
| Scope2 | 0.01 | 0.34 | 0.26 | 0.07 | Domestic Beverage Business: Electricity for offices and sales offices Pharmaceutical-Related Business: Electricity for offices, sales offices and factories Food Business: Electricity for offices, sales offices, and factories |
| Total | 0.07 (88.1%) |
0.72 (98.3%) |
0.45 (114.9%) |
0.17 (100.8%) |
|
| Scope3 | 0.80 (95.3%) |
- | - | 0.80 (95.3%) |
Domestic Beverage Business: Power consumption by vending machines |
- Note 1: The actual emissions in the domestic beverage business are those for DyDo DRINCO, Inc., DyDo Beverage Service, Inc., and DyDo Business Service, Inc.
- Note 2: We underwent a third-party verification for greenhouse gas emission information on 94 domestic bases of DyDo DRINCO, Inc., DyDo Beverage Service, Inc., and DyDo Business Service, Inc.
- Note 3: Emissions per unit of sales is obtained by dividing the total emissions of target group companies (period: April 1, 2021 - March 31, 2022) by total sales (period: domestic beverage business; Pharmaceutical-Related Business: January 21, 2021 - January 20, 2022; Food Business: January 1, 2021 - December 31, 2021)
- Note 4: Historical emissions and emissions per unit of sales have been changed due to tabulation errors and changes in emission factors at some locations. (Updated August 2023)
- * DyDo Beverage Service, Inc. absorbed Asahi Beverage Sales Co., Ltd. on January 21, 2025, and changed its name to DyDo Asahi Vending, Inc.
Actual CO2 emissions (FY2020 (base year))
| Domestic Beverage Business | Pharmaceutical-Related Business | Food Business | Total | Range of each scope | |
|---|---|---|---|---|---|
| Scope1 | 8,340 | 3,996 | 3,943 | 16,279 | Domestic Beverage Business: Gasoline for commercial and route vehicles / city gas, propane, kerosene for offices and sales offices Pharmaceutical-Related Business: Gasoline for commercial vehicles and forklifts Food Business: Gasoline for commercial vehicles and forklifts |
| Scope2 | 1,265 | 3,607 | 4,217 | 9,089 | Domestic Beverage Business: Electricity for offices and sales offices Pharmaceutical-Related Business: Electricity for offices, sales offices and factories Food Business: Electricity for offices, sales offices, and factories |
| Total | 9,605 | 7,603 | 8,160 | 25,368 | |
| Scope3 | 97,434 | - | - | 97,434 | Domestic Beverage Business: Power consumption by vending machines |
Actual CO2 emissions: the sales intensity (FY2020 (base year))
| Domestic Beverage Business | Pharmaceutical-Related Business | Food Business | Total | Range of each scope | |
|---|---|---|---|---|---|
| Scope1 | 0.07 | 0.39 | 0.19 | 0.11 | Domestic Beverage Business: Gasoline for commercial and route vehicles / city gas, propane, kerosene for offices and sales offices Pharmaceutical-Related Business: Gasoline for commercial vehicles and forklifts Food Business: Gasoline for commercial vehicles and forklifts |
| Scope2 | 0.01 | 0.35 | 0.20 | 0.06 | Domestic Beverage Business: Electricity for offices and sales offices Pharmaceutical-Related Business: Electricity for offices, sales offices and factories Food Business: Electricity for offices, sales offices, and factories |
| Total | 0.08 | 0.74 | 0.39 | 0.17 | |
| Scope3 | 0.84 | - | - | 0.84 | Domestic Beverage Business: Power consumption by vending machines |
- Note 1: The actual emissions in the domestic beverage business are those for DyDo DRINCO, Inc., DyDo Beverage Service, Inc., and DyDo Business Service, Inc.
- Note 2: We underwent a third-party verification for greenhouse gas emission information on 103 domestic bases of DyDo DRINCO, Inc., DyDo Beverage Service, Inc., and DyDo Business Service, Inc. (Updated February 2022)
- Note 3: Emissions per unit of sales is obtained by dividing the total emissions of target group companies (period: April 1, 2020 - March 31, 2021) by total sales (period: domestic beverage business; Pharmaceutical-Related Business: January 21, 2020 - January 20, 2021; Food Business: January 1, 2020 - December 31, 2020)
- Note 4: Historical emissions and emissions per unit of sales have been changed due to tabulation errors and changes in emission factors at some locations. (Updated August 2023)
- * DyDo Beverage Service, Inc. absorbed Asahi Beverage Sales Co., Ltd. on January 21, 2025, and changed its name to DyDo Asahi Vending, Inc.
Recycling and Service Life Extension of Vending Machines Contribute to a decarbonized,
recycling-oriented society
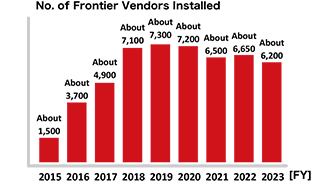
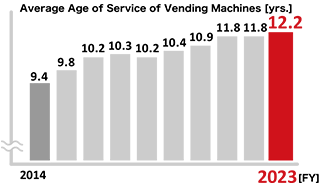
The service life of vending machines has extended by 29% over the last nine years; the average age of service of vending machines* increased from 9.4 years in FY 2014 to 12.2 years in FY 2023.
* Calculated based on the average age of service of all vending machines (including those that are not Frontier Vendors)

Reducing Power Consumption Contribute to a decarbonized,
recycling-oriented society
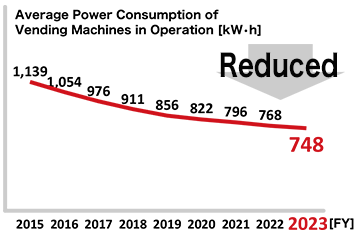
DyDo DRINCO’s constant efforts to improve energy efficiency has led to a 79.5% reduction in the annual power consumption of the major type of its vending machines from FY 2000.
In particular, in 2007, we started the full-scale introduction of vending machines with a heat pump function, which reuses the heat generated when cold beverages are cooled as a source of energy to heat hot beverages. Later, we have employed LED lighting, high-performance vacuum insulators, and other energy-saving components, significantly reducing power consumption.

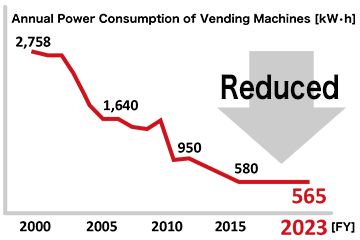
- * Annual power consumption per our vending machine of the major type
- * These figures for annual power consumption are measurements based on the Japanese Industrial Standards (JIS). Annual power consumption of a vending machine may vary with the operating environment.

Enhancing Efforts to Collect More Used Containers Contribute to a decarbonized,
recycling-oriented society
As part of our efforts to work on the issue of marine plastic waste and the effective use of natural resources, we have been establishing a system for route drivers to quickly collect used containers from recycle bins, which are installed next to beverage vending machines, when filling the machines with beverages.
We keep the areas around our vending machines clean and tidy so that consumers can comfortably use the machines. We also strive to prevent scattering of PET bottles, which may end up getting into the ocean, and to increase the recycling rate of PET bottles.

Efforts to Use Lighter and Thinner Cans Contribute to a decarbonized,
recycling-oriented society
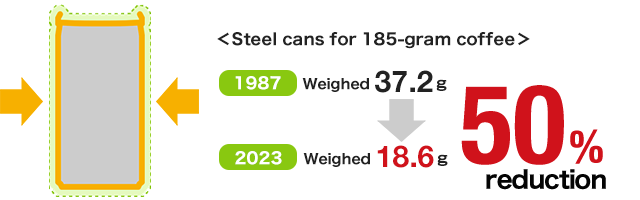
For canned coffee—one of DyDo DRINCO’s major products, the company uses new model TULC cans, which are the lightest steel cans of the same size in Japan. The steel cans for 185-gram coffee weigh 50% less than 33 years ago.
Furthermore, use of the new model TULC cans has contributed to less environmental load. Developed with the most advanced technologies, these lightest steel cans in Japan cause less carbon dioxide emissions when manufactured and do not require water when processed, which almost eliminates the solid waste generated during rinsing water treatment.
DyDo DRINCO's mainstay product is canned coffee, and steel cans are used to reduce environmental impact in manufacturing.
The recycle rate for steel cans in FY2022 was 92.7%.